Client Setup
Configure ROSI Collector clients for log forwarding, with Linux-specific metrics steps and Windows guidance via rsyslog Windows Agent.
This guide explains how to configure client hosts to send logs and metrics to your ROSI Collector. Each client needs rsyslog configured for log forwarding and optionally node_exporter for system metrics.
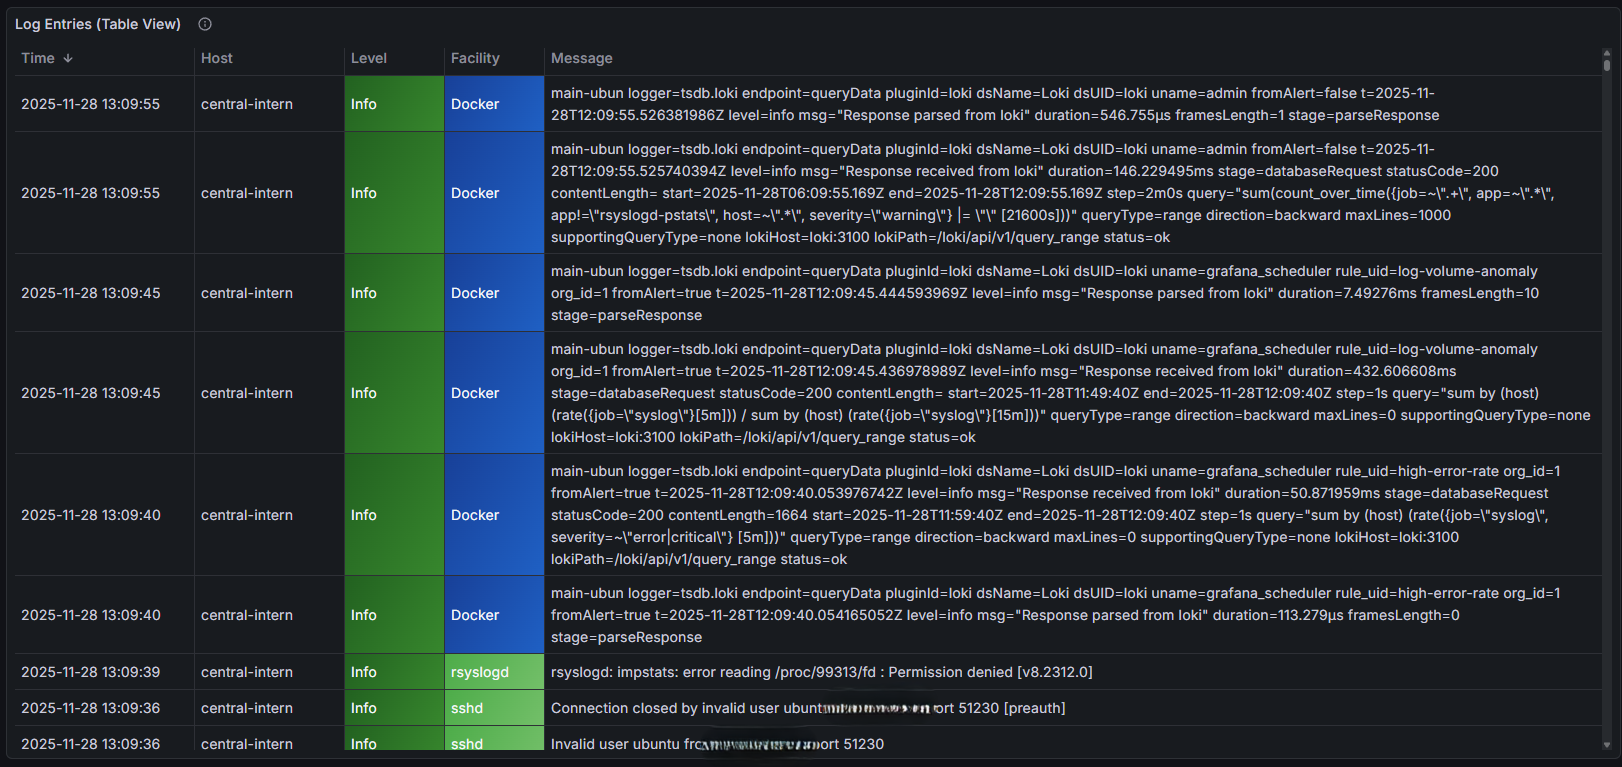
Client logs visible in Grafana Syslog Explorer
Overview
Client configuration involves:
rsyslog - Forward logs to the collector (TCP port 10514)
node_exporter - Expose metrics for Prometheus (port 9100)
impstats sidecar (optional) - Expose rsyslog internal metrics (port 9898) for the Syslog Health dashboard
Collector registration - Add client to Prometheus targets (node and/or impstats)
Quick Setup (Automated)
Download and run the setup scripts from your ROSI Collector:
rsyslog Client
# Download from your collector's downloads container
wget https://YOUR_COLLECTOR_DOMAIN/downloads/install-rsyslog-client.sh
chmod +x install-rsyslog-client.sh
sudo ./install-rsyslog-client.sh
Node Exporter
wget https://YOUR_COLLECTOR_DOMAIN/downloads/install-node-exporter.sh
chmod +x install-node-exporter.sh
sudo ./install-node-exporter.sh
Replace YOUR_COLLECTOR_DOMAIN with your ROSI Collector’s base domain
(the same value as TRAEFIK_DOMAIN in your .env file).
Windows Clients
For Windows systems, use rsyslog Windows Agent as the official ROSI Windows-side collector/forwarder. The official rsyslog FAQ notes that rsyslog itself, including the Linux rsyslog collector/forwarder used elsewhere in this guide, does not run natively on Windows and points Windows users to the agent: Does rsyslog run under Windows?.
The agent is a commercial, closed-source Windows collector from the same team behind rsyslog. It is optimized to work with rsyslog-based backends, and its commercial support helps fund ongoing rsyslog development on Linux: Windows Agent support.
From a ROSI Collector perspective, it fills the same client-side role as the Linux rsyslog forwarder: collect logs at the edge, buffer and process them efficiently, and forward them to the central collector. The product manual describes support for Windows Event Log collection, text log files, syslog relay, filtering, and forwarding over UDP, TCP, TLS, and RELP: rsyslog Windows Agent manual.
Within the broader ROSI stack, this fits the same general pattern as other supported components: use the part that best matches the source platform and operational need. That can include Adiscon-side components such as WinSyslog or EventReporter in some deployments, just as other ROSI profiles may combine rsyslog with Grafana, Elasticsearch, or Splunk where appropriate.
The agent is built on Adiscon’s mature Windows log collection technology, which is designed for robust, resource-efficient event collection and is tuned to integrate well with rsyslog environments. For more background, see the Windows Event Log format and technology background and feature overview.
This Windows section covers log forwarding only. The node_exporter,
impstats sidecar, and port 9100 metrics steps later in this page are
Linux-oriented and do not apply to Windows hosts using rsyslog Windows Agent.
Manual Setup: rsyslog
If you prefer manual configuration, follow these steps.
Step 1: Install rsyslog
Most Linux distributions include rsyslog by default. Verify it’s installed:
rsyslogd -v
# rsyslogd  8.2302.0 (aka 2023.02) ...
If not installed:
# Debian/Ubuntu
sudo apt install rsyslog

# RHEL/CentOS/Rocky
sudo dnf install rsyslog
Step 2: Configure Forwarding
Create a forwarding configuration file:
sudo nano /etc/rsyslog.d/60-forward-to-collector.conf
Add this configuration:
# Forward all logs to ROSI Collector
# Replace COLLECTOR_IP with your collector's IP or hostname

# Use queue for reliable delivery
$ActionQueueType LinkedList
$ActionQueueFileName collector-queue
$ActionQueueMaxDiskSpace 1g
$ActionQueueSaveOnShutdown on
$ActionResumeRetryCount -1

# Forward to collector
*.* @@COLLECTOR_IP:10514
Replace COLLECTOR_IP with your ROSI Collector’s IP address or hostname.
Step 3: Restart rsyslog
sudo systemctl restart rsyslog
Step 4: Test Forwarding
Send a test message:
logger "Test message from $(hostname)"
Check Grafana’s Explore interface to verify the message arrived.
Manual Setup: rsyslog with TLS
For encrypted log transport, configure TLS on port 6514. This requires the collector to have TLS enabled (see Installation).
Step 1: Install rsyslog-openssl
The OpenSSL network stream driver is required:
# Debian/Ubuntu
sudo apt install rsyslog-openssl

# RHEL/CentOS/Rocky
sudo dnf install rsyslog-openssl
Step 2: Get CA Certificate
Download the CA certificate from your collector:
# Download CA cert from the downloads container
sudo mkdir -p /etc/rsyslog.d/certs
sudo wget -O /etc/rsyslog.d/certs/ca.pem \
    https://YOUR_COLLECTOR_DOMAIN/downloads/ca.pem
For mTLS, get your client certificate package from the admin and install it:
# Download one-time package (URL from admin)
wget https://YOUR_COLLECTOR_DOMAIN/downloads/tls-packages/CLIENT_TOKEN.tar.gz

# Extract and install
tar xzf CLIENT_TOKEN.tar.gz
cd CLIENT_NAME
sudo ./install.sh
Step 3: Configure TLS Forwarding
Create a TLS forwarding configuration:
sudo nano /etc/rsyslog.d/60-forward-tls.conf
For server-only auth (anon mode):
# TLS settings - OpenSSL driver loads automatically
global(
    workDirectory="/var/spool/rsyslog"
    DefaultNetstreamDriver="ossl"
    DefaultNetstreamDriverCAFile="/etc/rsyslog.d/certs/ca.pem"
)

# Forward all logs via TLS
*.* action(
    type="omfwd"
    target="COLLECTOR_HOSTNAME"
    port="6514"
    protocol="tcp"
    StreamDriver="ossl"
    StreamDriverMode="1"
    StreamDriverAuthMode="anon"
    queue.type="LinkedList"
    queue.size="10000"
    queue.filename="fwd_tls"
    queue.saveOnShutdown="on"
    action.resumeRetryCount="-1"
)
For mutual TLS (x509/certvalid or x509/name):
# TLS settings with client certificate
global(
    workDirectory="/var/spool/rsyslog"
    DefaultNetstreamDriver="ossl"
    DefaultNetstreamDriverCAFile="/etc/rsyslog.d/certs/ca.pem"
    DefaultNetstreamDriverCertFile="/etc/rsyslog.d/certs/client-cert.pem"
    DefaultNetstreamDriverKeyFile="/etc/rsyslog.d/certs/client-key.pem"
)

# Forward all logs via mTLS
*.* action(
    type="omfwd"
    target="COLLECTOR_HOSTNAME"
    port="6514"
    protocol="tcp"
    StreamDriver="ossl"
    StreamDriverMode="1"
    StreamDriverAuthMode="x509/name"
    queue.type="LinkedList"
    queue.size="10000"
    queue.filename="fwd_tls"
    queue.saveOnShutdown="on"
    action.resumeRetryCount="-1"
)
Replace COLLECTOR_HOSTNAME with your collector’s hostname.
Step 4: Restart rsyslog
sudo systemctl restart rsyslog
Step 5: Test TLS Connection
# Test TLS handshake
openssl s_client -connect COLLECTOR_HOSTNAME:6514 \
    -CAfile /etc/rsyslog.d/certs/ca.pem

# Send test message
logger "TLS test from $(hostname)"
Manual Setup: Node Exporter
Node exporter provides system metrics (CPU, memory, disk, network) to Prometheus.
Step 1: Download Node Exporter
# Get latest version
VERSION=$(curl -s https://api.github.com/repos/prometheus/node_exporter/releases/latest | grep tag_name | cut -d '"' -f 4 | tr -d 'v')

wget https://github.com/prometheus/node_exporter/releases/download/v${VERSION}/node_exporter-${VERSION}.linux-amd64.tar.gz
tar xzf node_exporter-${VERSION}.linux-amd64.tar.gz
sudo mv node_exporter-${VERSION}.linux-amd64/node_exporter /usr/local/bin/
Step 2: Create Systemd Service
sudo tee /etc/systemd/system/node_exporter.service << 'EOF'
[Unit]
Description=Prometheus Node Exporter
After=network.target

[Service]
User=nobody
ExecStart=/usr/local/bin/node_exporter
Restart=always

[Install]
WantedBy=multi-user.target
EOF
Step 3: Start Service
sudo systemctl daemon-reload
sudo systemctl enable --now node_exporter
Step 4: Configure Firewall
Allow your ROSI Collector to scrape metrics:
sudo ufw allow from COLLECTOR_IP to any port 9100 proto tcp
Replace COLLECTOR_IP with your collector’s IP address.
Step 5: Verify
curl http://localhost:9100/metrics | head
Register Client on Collector
After configuring the client, add it to Prometheus targets on your
ROSI Collector server using the prometheus-target CLI tool.
Note
The collector server itself is automatically added to node_exporter
and impstats targets by init.sh (impstats only when the sidecar
is installed on the server).
Node exporter only (port 9100):
# SSH to your ROSI Collector, then:
prometheus-target add CLIENT_IP:9100 host=CLIENT_HOSTNAME [role=ROLE] [network=NETWORK]
Node exporter and impstats sidecar (ports 9100 and 9898) in one step:
prometheus-target add-client CLIENT_IP host=CLIENT_HOSTNAME [role=ROLE] [network=NETWORK]
Impstats only (when the client runs the impstats sidecar on port 9898):
prometheus-target --job impstats add CLIENT_IP:9898 host=CLIENT_HOSTNAME [role=ROLE] [network=NETWORK]
Example:
prometheus-target add 10.0.0.50:9100 host=webserver-01 role=web network=production
# Or both node and impstats:
prometheus-target add-client 10.0.0.50 host=webserver-01 role=web network=internal
Available commands:
prometheus-target add <IP:PORT> host=<name> [role=<value>] [network=<value>]
prometheus-target --job impstats add <IP:9898> host=<name> role=rsyslog [network=<value>]
prometheus-target add-client <IP> host=<name> [role=<value>] [network=<value>]
prometheus-target list
prometheus-target remove <IP:PORT>      # Remove by IP:port
prometheus-target remove <hostname>     # Remove by hostname
Available labels:
host(required) - Hostname for identificationrole- Server role (web, db, app, etc.)network- Network zone (internal, dmz, production)env- Environment (prod, staging, dev)Any custom
key=valuelabel
List all targets:
prometheus-target list
Remove a target (either by IP:port or hostname):
prometheus-target remove 10.0.0.50:9100
# or
prometheus-target remove webserver-01
Prometheus picks up changes within 5 minutes automatically.
Verification
Test Log Forwarding
# On client
logger "Hello from $(hostname)"

# On collector (or via Grafana)
# Search for the message in Syslog Explorer
Test Metrics Collection
Go to Grafana → Host Metrics Overview dashboard
Select your client from the host dropdown
Verify CPU, memory, and disk metrics appear (Syslog Health shows impstats when the client runs the sidecar)
Check Connection Status
On the client, verify rsyslog queue status:
sudo cat /var/spool/rsyslog/collector-queue*
An empty or missing queue indicates messages are flowing.
Troubleshooting
Logs not appearing
Check rsyslog status:
sudo systemctl status rsyslogTest connectivity:
telnet COLLECTOR_IP 10514Check queue directory:
ls -la /var/spool/rsyslog/
Metrics not appearing
Check node_exporter:
sudo systemctl status node_exporterTest locally:
curl http://localhost:9100/metricsCheck firewall:
sudo ufw status
See also: Troubleshooting
Next Steps
Grafana Dashboards - Explore log data in dashboards
Troubleshooting - Solve common problems
Support: rsyslog Assistant | GitHub Discussions | GitHub Issues: rsyslog source project
Contributing: Source & docs: rsyslog source project
© 2008–2026 Rainer Gerhards and others. Licensed under the Apache License 2.0.