Learn how to deploy ROSI Collector on Hetzner Cloud, configure client servers to forward logs and metrics, and use Grafana dashboards for visualization. Includes TLS/mTLS, firewall rules, and troubleshooting. .. summary-end
Deploying ROSI Collector on Hetzner Cloud
This tutorial guides you through deploying the ROSI (Rsyslog Operations Stack Initiative) Collector on Hetzner Cloud for centralized log aggregation and monitoring from multiple VPS instances.
Note
For generic installation and client setup, see ROSI Collector and Client Setup. This tutorial focuses on Hetzner Cloud-specific deployment.
Introduction
Managing logs and metrics across multiple Hetzner Cloud VPS instances can be challenging. Without centralized observability, you’re left checking individual servers, making it difficult to correlate events, troubleshoot issues, or maintain a comprehensive view of your infrastructure.
ROSI Collector provides a production-ready, self-hosted solution for centralized log aggregation and monitoring. Built on open-source technologies—rsyslog, Loki, Grafana, and Prometheus—ROSI Collector offers a lightweight alternative to resource-intensive stacks like ELK, while maintaining full data sovereignty and privacy.
Key Benefits:
Self-hosted and privacy-focused: Your logs stay in your infrastructure
Resource-efficient: Lower memory and CPU footprint than ELK and similar stacks
Production-ready: Includes pre-configured dashboards, alerting, and TLS support
Multi-server aggregation: Collect logs and metrics from unlimited client servers
Cost-effective: Runs efficiently on Hetzner Cloud CX22 or larger instances
Prerequisites
A Hetzner Cloud Server (CX22 or larger recommended) running Ubuntu 24.04 LTS
For environments with more than 10 clients or high log verbosity (e.g. DEBUG level), consider CPX31 or CX32 for more stable Loki performance.
Root or sudo access
Docker Engine 20.10+ and Docker Compose v2 (on a fresh server you can install them in one go using the ROSI script in the “Prepare fresh server” step; otherwise see howto-docker-install)
Basic knowledge of Linux command line, Docker, and YAML
(Optional) A domain name for TLS certificates via Let’s Encrypt
(Optional) Additional Hetzner Cloud VPS instances to act as clients
Example terminology
Username:
holuHostname:
<your_host>Domain:
<example.com>ROSI Collector server IP:
<YOUR_COLLECTOR_PUBLIC_IP>Client server IP:
<YOUR_CLIENT_PUBLIC_IP>
Architecture Overview
ROSI Collector uses a centralized architecture where multiple client servers forward logs and metrics to a single collector server. The collector processes, stores, and visualizes this data through a web interface.

ROSI Collector architecture - centralized logging with rsyslog, Loki, and Grafana
Components:
rsyslog - Receives syslog messages from clients via TCP port 10514 (or TLS on 6514)
Loki - Stores and indexes log data efficiently
Grafana - Provides web-based dashboards for log visualization and querying
Prometheus - Collects and stores metrics from node_exporter instances
Traefik - Reverse proxy with automatic TLS certificate management
node_exporter - Installed on each client (and the collector server) to expose system metrics
Data Flow:
Client servers forward syslog messages → ROSI Collector (TCP 10514/6514)
rsyslog receives logs → Forwards to Loki via HTTP
Loki stores logs → Grafana queries Loki for visualization
Prometheus scrapes node_exporter → Stores metrics → Grafana visualizes metrics
Users access Grafana via Traefik (HTTPS) → View dashboards and query logs
Network Requirements:
Inbound on collector: TCP 80, 443 (Traefik), 9090 (Prometheus UI), 10514 (rsyslog plaintext), 6514 (rsyslog TLS, optional)
Outbound from clients: TCP 10514/6514 to collector
Inbound on clients: TCP 9100 (node_exporter, from collector)
Step 1 - Deploy ROSI Collector
In this step, we’ll clone the ROSI Collector repository, initialize the environment, and start the Docker Compose stack. See Installation for full installation details.
Prepare fresh server (first time only)
If this is a new/fresh Hetzner Cloud server and Docker is not yet installed, run the prepare script once before initializing. It installs Docker, configures the firewall, and applies optional hardening (sysctl, fail2ban, logrotate, etc.):
# From rosi-collector directory (after clone)
sudo ./scripts/install-server.sh
The script will ask before installing each configuration file. For a fully automated run:
sudo NONINTERACTIVE=1 ./scripts/install-server.sh
Warning
Only run this on fresh systems. Do not use it on servers you already maintain—it modifies system configuration and installs packages. If Docker is already installed (e.g. via howto-docker-install), skip this step and go to the next section.
Initialize Environment
The initialization script (init.sh) will prompt you for configuration
values and set up the entire environment. Run it with sudo:
sudo ./scripts/init.sh
Interactive Prompts:
The script will ask for the following information:
Installation directory (default:
/opt/rosi-collector)Press Enter to accept the default, or specify a custom path
Your choice is saved for future runs (e.g. to
~/.config/rsyslog/rosi-collector.confor/etc/rsyslog/rosi-collector.conf) and reused automatically on later runs
TRAEFIK_DOMAIN - Domain or IP address for accessing Grafana - If you have a domain:
logs.example.com- If using IP only:<YOUR_COLLECTOR_PUBLIC_IP>(will use self-signed certificate) - This is requiredTRAEFIK_EMAIL - Email for Let’s Encrypt certificate notifications - Example:
admin@example.com- Required for Let’s Encrypt (not needed if using IP only)GRAFANA_ADMIN_PASSWORD - Password for Grafana admin user - Press Enter to auto-generate a secure password (recommended) - Or enter your own password - The password will be shown at the end of setup and saved in
.envTLS Configuration - Enable encrypted syslog on port 6514 - Choose
yfor production environments (recommended) - ChooseNfor testing or if you’ll use a VPN - If enabled, you’ll configure TLS hostname and authentication modeServer syslog forwarding - Forward the collector server’s own logs - Choose
Yto include the collector server’s logs in Grafana (recommended) - Choosenif you only want client logs
When you run the script, output will look similar to:
Loaded configuration from: /root/.config/rsyslog/rosi-collector.conf
Copying configuration files to /opt/rosi-collector...
Rendering Grafana dashboards from templates (source)...
Installing local Grafana dashboards...
Downloading Grafana dashboards from grafana.com...
Successfully downloaded dashboard 1860
Successfully downloaded dashboard 14055
Total dashboards installed: 13

━━━━━━━━━━━━━━━━━━━━━━━━━━━━━━━━━━━━━━━━━━━━━━━━━━━━━━━━━━━━
  ROSI Collector Configuration
━━━━━━━━━━━━━━━━━━━━━━━━━━━━━━━━━━━━━━━━━━━━━━━━━━━━━━━━━━━━

No .env file found. Please provide the following configuration:

TRAEFIK_DOMAIN - The domain or IP address for accessing Grafana/Prometheus
Examples: rosi.example.com, 192.168.1.100
Enter domain or IP: logs.example.com

TRAEFIK_EMAIL - Email for Let's Encrypt certificate notifications
Enter email [admin@logs.example.com]:

GRAFANA_ADMIN_PASSWORD - Leave empty to auto-generate a secure password
Enter password (hidden) or press Enter to generate:

Enable TLS for syslog? [y/N]: y

TLS hostname [logs.example.com]:
CA certificate validity in days [3650] (10 years):
Server certificate validity in days [1825] (5 years):
Client certificate validity in days [730] (2 years):

Authentication mode:
  anon        - TLS encryption only (no client certificates)
  x509/certvalid - Require valid client certificates (mTLS)
  x509/name   - Require certificates + verify CN/SAN (strictest)
Auth mode [anon]:

Created .env file
Configure server to forward its syslog to ROSI Collector? [Y/n]: y
Configuration test passed
Restarting rsyslog service...
rsyslog service restarted successfully

OK. ROSI Collector environment ready:
  /opt/rosi-collector
  Systemd service: rosi-collector-docker.service
  Monitor script: /usr/local/bin/rosi-monitor
  Prometheus target helper: /usr/local/bin/prometheus-target
  node_exporter: installed and running on this server
  TLS: enabled (port 6514, authmode: anon)

IMPORTANT: Save your credentials!
  Grafana URL:    https://logs.example.com/
  Username:       admin
  Password:       (stored in /opt/rosi-collector/.env)

Next steps:
  cd /opt/rosi-collector && docker compose up -d
Important: Save the Grafana admin password shown at the end of the script output. You’ll need it to log into Grafana.
Non-interactive init: You can run the script without prompts:
sudo TRAEFIK_DOMAIN=logs.example.com TRAEFIK_EMAIL=admin@example.com ./scripts/init.sh
Optionally add SERVER_SYSLOG_FORWARDING=true to also enable forwarding the
collector server’s own logs without prompting.
Start the Stack
Navigate to the installation directory and start the Docker Compose stack:
cd /opt/rosi-collector
docker compose up -d
The first time you run this, Docker will pull the required images (Prometheus, Traefik, rsyslog-collector, nginx, Loki, Grafana), create the data volumes, and then start the containers.
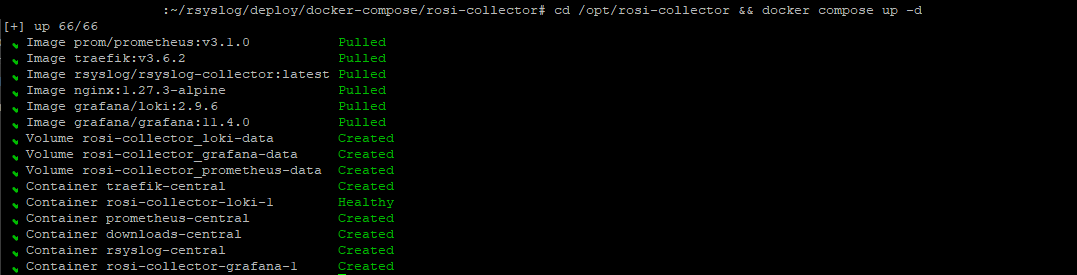
First-time stack start: docker compose up -d
Subsequent runs start the existing containers without re-pulling. Wait a few moments for containers to initialize.
Verify Services are Running
docker compose ps
You should see all services in “Up” status. Alternatively:
rosi-monitor status
Check Service Logs
If any service fails to start:
docker compose logs rsyslog
docker compose logs grafana
docker compose logs loki
docker compose logs -f
Common issues: Port conflicts (80, 443, 9090, 10514, 6514), permission errors,
network issues. Check with docker network ls.
Configure Firewall
If you’re using UFW (Uncomplicated Firewall):
sudo ufw allow 80/tcp
sudo ufw allow 443/tcp
sudo ufw allow 9090/tcp
sudo ufw allow 10514/tcp
sudo ufw allow 6514/tcp
sudo ufw status
Note
If your Hetzner Cloud server uses the Hetzner Cloud Firewall (configured in the Cloud Console), you’ll need to add rules there as well. The Hetzner Cloud Firewall operates at the network level and is separate from UFW.
Step 2 - Configure Client Servers
Now that the ROSI Collector is running, configure client servers to forward logs and metrics. See Client Setup for detailed client configuration.
Download Client Setup Script
On each client server, download the rsyslog client setup script from your ROSI Collector:
wget https://<YOUR_COLLECTOR_PUBLIC_IP>/downloads/install-rsyslog-client.sh
chmod +x install-rsyslog-client.sh
Note
If using an IP address instead of a domain, you may need to accept a
self-signed certificate warning. For wget, add the --no-check-certificate flag.
The client script can optionally set up an rsyslog impstats sidecar (port
9898) for the “Syslog Health” dashboard. To skip it, run:
sudo ./install-rsyslog-client.sh --no-sidecar.
Run Client Setup Script
sudo ./install-rsyslog-client.sh
The script will prompt for ROSI Collector IP, port (default 10514), then install rsyslog forwarding, create spool directory, and restart rsyslog.
Test Log Forwarding
logger "Test message from $(hostname) at $(date)"
This message should appear in Grafana within a few seconds.
Install Node Exporter (Optional but Recommended)
wget https://<YOUR_COLLECTOR_PUBLIC_IP>/downloads/install-node-exporter.sh
chmod +x install-node-exporter.sh
sudo ./install-node-exporter.sh
Verify node_exporter is running:
sudo systemctl status node_exporter
curl http://localhost:9100/metrics | head -5
Add Client to Prometheus Targets
On the ROSI Collector server:
Option A - node_exporter only (port 9100):
sudo prometheus-target add <YOUR_CLIENT_PUBLIC_IP>:9100 host=webserver role=web network=internal
Option B - node_exporter and impstats sidecar (ports 9100 and 9898):
sudo prometheus-target add-client <YOUR_CLIENT_PUBLIC_IP> host=webserver role=web network=internal
Label options: host=<name>, role=<value>, env=<value>,
network=<value>.
sudo prometheus-target list
Configure Client Firewall
On each client, allow node_exporter (and impstats if used) from the collector:
sudo ufw allow from <YOUR_COLLECTOR_PUBLIC_IP> to any port 9100 proto tcp
sudo ufw allow from <YOUR_COLLECTOR_PUBLIC_IP> to any port 9898 proto tcp
sudo ufw status | grep -E '9100|9898'
Note
If using Hetzner Cloud Firewall, add rules allowing TCP ports 9100 (and 9898 if using impstats) from the ROSI Collector server’s IP.
Verify Client Connectivity
From the ROSI Collector server, verify you can reach the client’s node_exporter:
curl http://<YOUR_CLIENT_PUBLIC_IP>:9100/metrics | head -10
To verify the client can send logs to the collector, run from the client:
telnet <YOUR_COLLECTOR_PUBLIC_IP> 10514.
Step 3 - Access Grafana Dashboard
Access Grafana
Open your browser and navigate to:
https://<YOUR_COLLECTOR_DOMAIN_OR_IP>(this is the value you set forTRAEFIK_DOMAIN)
Note
If using a self-signed certificate (IP address mode), your browser will show a security warning. Click “Advanced” and “Proceed to site” to continue.
Login to Grafana
Username:
adminPassword: From the end of
init.shoutput, or:
grep GRAFANA_ADMIN_PASSWORD /opt/rosi-collector/.env
Explore Pre-built Dashboards
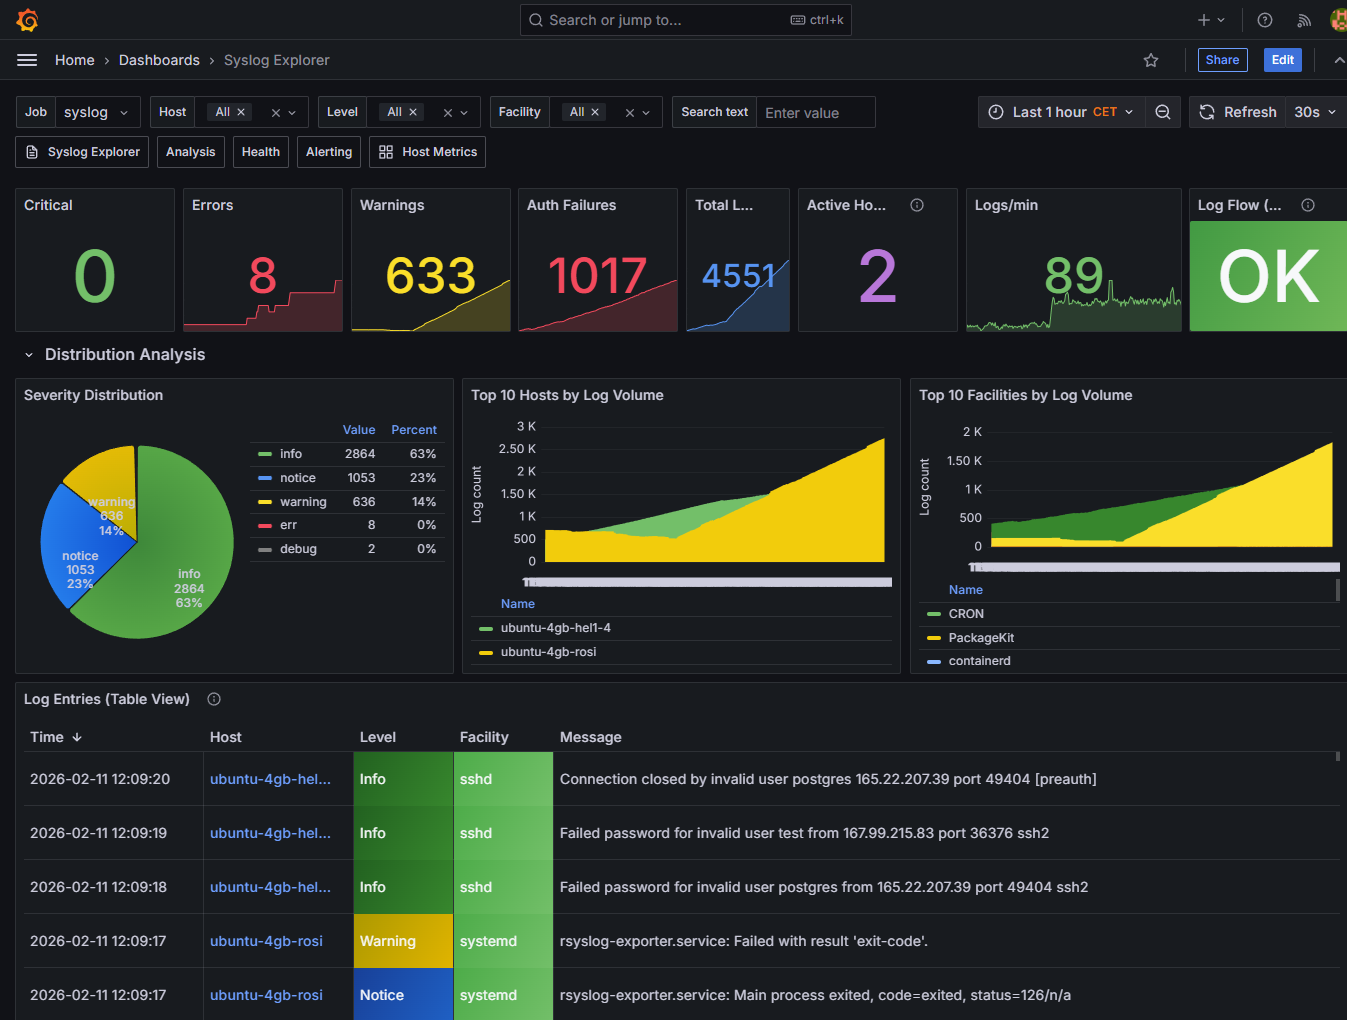
Grafana Dashboards - Syslog Explorer and dashboard browser
Available Dashboards:
Syslog Explorer - Search and browse logs from all clients
Syslog Analysis - Distribution analysis (severity, hosts, facilities)
Syslog Health - rsyslog impstats; requires impstats sidecar
Host Metrics Overview - System metrics from node_exporter
Alerting Overview - Active alerts and notification status
Query Logs in Grafana
In the Syslog Explorer dashboard: search bar, filter by host, time range.
Example LogQL queries (in Grafana Explore):
{host="webserver"}
{host=~".+"} |= "error"
{facility="auth"}
{host=~".+"} |= "failed"
View Metrics Dashboards
Open “Host Metrics Overview” for CPU, memory, disk I/O, network, load average.
Step 4 - Advanced Configuration
Enable TLS/mTLS for Syslog
Edit
.env:SYSLOG_TLS_ENABLED=true,SYSLOG_TLS_HOSTNAME=logs.example.com,SYSLOG_TLS_AUTHMODE=anonRe-run
sudo ./scripts/init.shfrom the cloned rosi-collector directoryRestart:
cd /opt/rosi-collector && docker compose restart rsyslog
Authentication Modes: anon (server-only), x509/certvalid (mTLS),
x509/name (mTLS with name validation).
Generate client certificates:
rosi-generate-client-cert --download client-hostname
Configure Log Retention
Edit /opt/rosi-collector/loki-config.yml:
limits_config:
  retention_period: 720h  # 30 days (default)
  # Change to 168h for 7 days, or 2160h for 90 days
Restart Loki: docker compose restart loki
Add More Clients
Repeat Step 2 for each new server. Quick checklist:
[ ] Download and run
install-rsyslog-client.shon client[ ] (Optional) Install node_exporter on client
[ ] Add client to Prometheus:
sudo prometheus-target add-client <IP> host=<name> role=<role> network=<network>[ ] Configure client firewall for 9100 (and 9898 if impstats)
[ ] Verify connectivity and test log forwarding
Configure Hetzner Cloud Firewall
ROSI Collector Server: Inbound TCP 80, 443, 9090, 10514, 6514
Client Servers: Inbound TCP 9100 from collector IP; outbound TCP 10514, 6514 to collector
In Hetzner Cloud Console → Firewalls:
Rule for ROSI Collector: Direction Inbound, Port 80, 443, 9090, 10514, 6514
Rule for Clients: Direction Inbound, Port 9100, Source: collector IP
Monitor Stack Health
rosi-monitor status
rosi-monitor logs
rosi-monitor health
rosi-monitor debug
See Troubleshooting for the full list.
Step 5 - Troubleshooting
Logs Not Appearing in Grafana
Check rsyslog on collector:
docker compose logs rsyslog | tail -50Verify Loki:
curl http://localhost:3100/ready(should return “Ready”)Test client connectivity (from a client machine):
telnet <YOUR_COLLECTOR_PUBLIC_IP> 10514On client:
sudo rsyslogd -N1,sudo systemctl status rsyslog
rsyslog omfwd errors: Remove any explicit module(load="omfwd"); the
omfwd action is built-in.
Container Won’t Start
Check logs:
docker compose logs <service-name>Verify disk space:
df -h(10GB+ free recommended)Check Docker:
systemctl status dockerVerify ports:
sudo netstat -tlnp | grep -E ':(80|443|10514|6514|3000|3100|9090)'
Prometheus Can’t Scrape node_exporter
Server target down: The node_exporter must bind to Docker bridge gateway.
Check grep listen-address /etc/systemd/system/node_exporter.service and
rosi-monitor status for network info.
Client targets down:
On client:
sudo systemctl status node_exporter,curl http://localhost:9100/metricsVerify firewall:
sudo ufw status | grep 9100From collector:
curl http://<YOUR_CLIENT_PUBLIC_IP>:9100/metricsPrometheus UI:
https://logs.example.com:9090→ Status → Targets
High Memory Usage
Check:
free -h,docker statsTo reduce Loki’s memory usage, edit
/opt/rosi-collector/loki-config.ymland add the following underlimits_config:ingestion_rate_mb: 10 ingestion_burst_size_mb: 20
Reduce retention (see the “Configure Log Retention” section)
Upgrade to CX32 or larger for high load
TLS Certificate Issues
Verify certs:
ls -la /opt/rosi-collector/certs/(ca.pem, server-cert.pem, server-key.pem)Check validity:
openssl x509 -in /opt/rosi-collector/certs/server-cert.pem -text -noout | grep -A 2 ValidityRegenerate:
sudo rm -rf /opt/rosi-collector/certs/thensudo ./scripts/init.sh
Conclusion
You’ve successfully deployed ROSI Collector on Hetzner Cloud. Your observability stack now provides:
Centralized log aggregation from all Hetzner Cloud VPS instances
System metrics collection via Prometheus and node_exporter
Web-based visualization through Grafana dashboards
Production-ready features including TLS support, alerting, and log retention
Next Steps:
Explore additional Grafana dashboards
Configure alerting rules in Prometheus
Set up TLS/mTLS for production
Add more client servers
Additional Resources:
ROSI Collector - ROSI Collector overview
Installation - Full installation guide
Client Setup - Client setup details
Grafana Dashboards - Grafana dashboards
Troubleshooting - Troubleshooting guide
Maintenance Tips:
Regularly check
rosi-monitor statusMonitor disk usage in
/opt/rosi-collectorReview and rotate log retention
Keep Docker and container images updated
Backup the
.envfile and configuration directory
Attribution
Based on the Hetzner Community tutorial by alorbach (MIT licensed).
Support: rsyslog Assistant | GitHub Discussions | GitHub Issues: rsyslog source project
Contributing: Source & docs: rsyslog source project
© 2008–2026 Rainer Gerhards and others. Licensed under the Apache License 2.0.